Hello everyone, this blog shows how we can import data from csv and plot as mesg grid chart in python libraries, through the help of Pycharm IDE (Community Version)
Prerequisite :
- 1. Install Python 3.6
- 2. Download Pycharm IDE (Community Version)
- 3. Basic knowledge of Python programming language
The following are the steps for creating mesh-grid in pycharm :
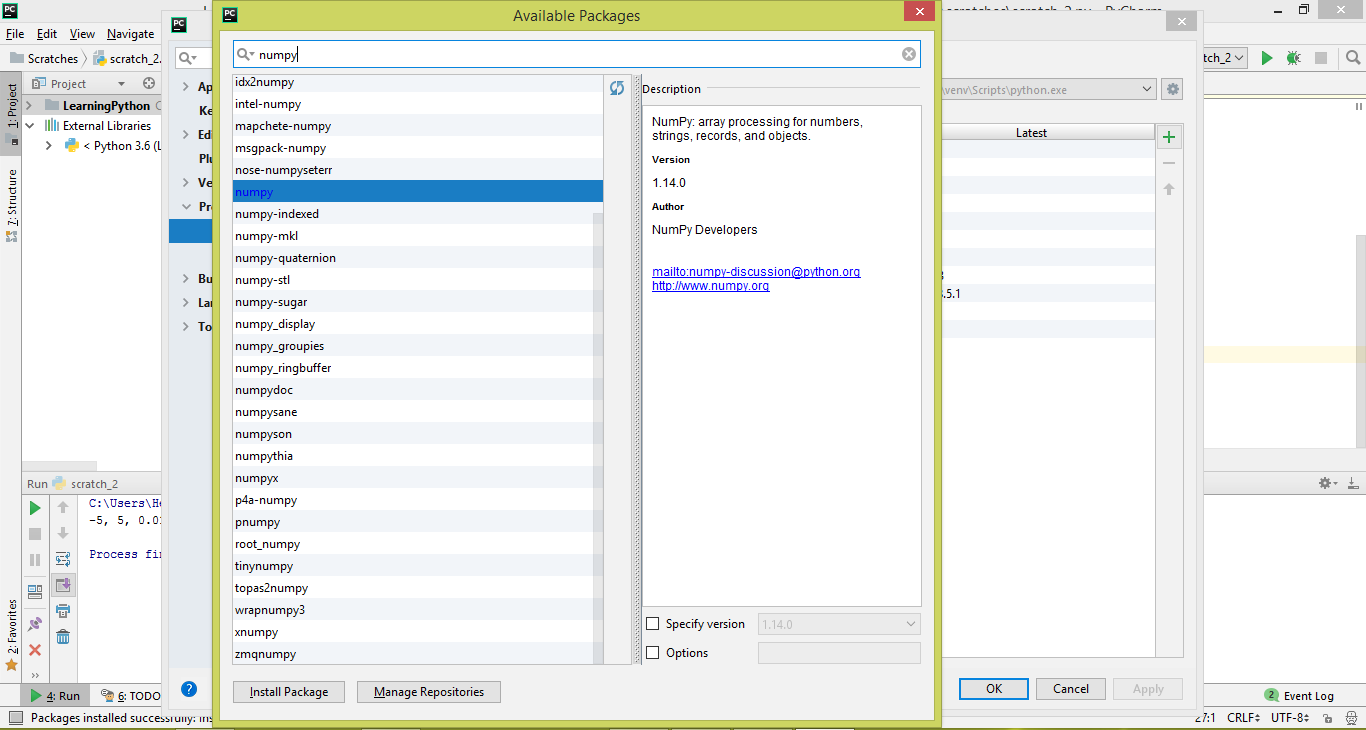
1. Installing NumPy,Pandas and Matplotlib libraries in Pycharm IDE :
-
- 1. Create a scratch file in Pycharm.
- 2. Click on “File” and goto settings.
- 3. Goto “Project Interpreter” and click on ‘+’ symbol to add new libraries.
2. Writing python code for importing csv data and creating meshgrid :
-
- 1. Create a csv file containing these data “-5,5,0.01”.
- 2. Use this python code in your scratch file .
import csv

import numpy as np

import matplotlib.pyplot as plt
point = “”
with open(‘C:/Users/Helical/Desktop/Blog/Python/MeshGrid.csv’,’r’) as csvfile:
meshreader = csv.reader(csvfile, delimiter=’,’)
for row in meshreader:
point = point + ‘, ‘.join(row)
print(point)
meshpoints = point.split(‘,’)
points = np.arange(float(meshpoints[0]),float(meshpoints[1]),float(meshpoints[2]))
dx, dy = np.meshgrid(points,points)
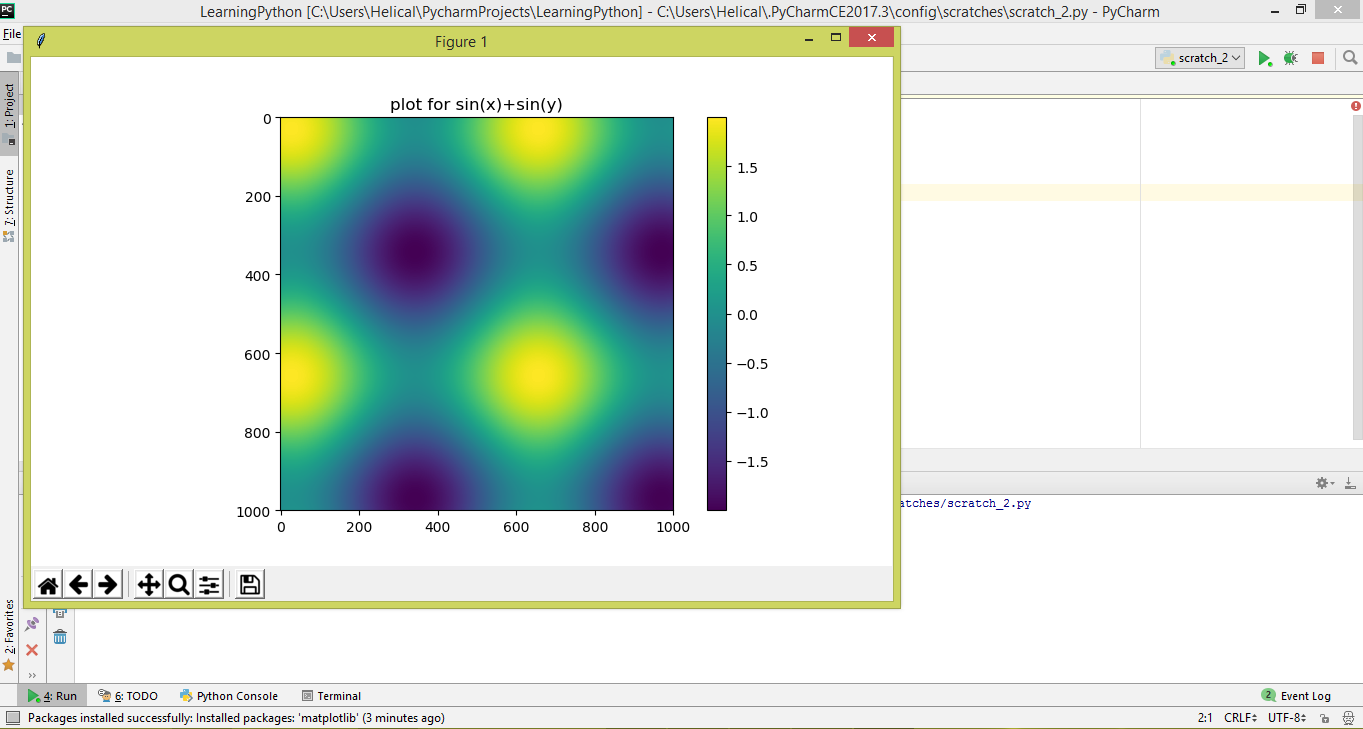
z = (np.sin(dx)+np.sin(dy))
plt.imshow(z)
plt.colorbar()
plt.title(‘plot for sin(x)+sin(y)’)
plt.show()
- If you are able to sucessfully run the code, then you will generate mesh grid in an new Pycharm window.


Best Open Source Business Intelligence Software Helical Insight is Here